
A New Hope
Highlights from the recently released Hope Scholarship Program annual report

In a time where ESA programs are growing rapidly across our country, transparency and quality reporting is as important as ever. Not just for researchers like me, but for lawmakers and advocates hoping to get an idea of how these programs are unfolding.
Enter West Virginia’s Hope Scholarship Program’s 2024-25 annual report, which was recently posted on the program’s website. Simply put, it is one of the best annual reports of an expansive school choice program one can find.
Below I’ll break down a few of the highlights:
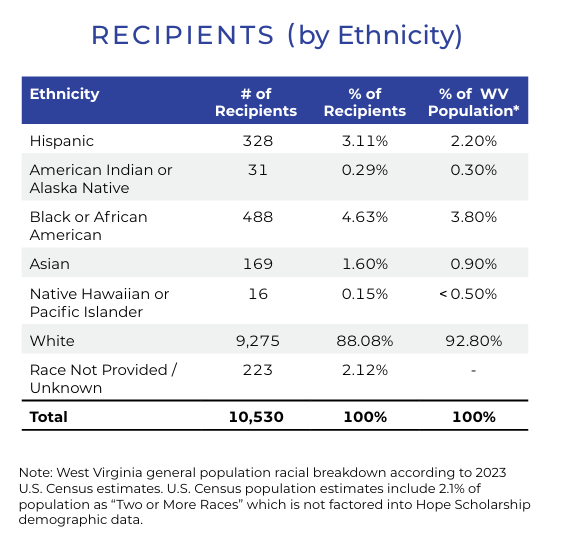
1. The “Who” of the WV Hope Scholarship program. Towards the top of the report are key details related to the demographic information of WV Hope participants. The report breaks down recipients by county (also by ZIP code in the appendix), as well as by race, gender, and grade level. There are a few threads worth pulling on in this demographic data.
Typically, one of the first questions asked is how diverse the program is compared to the diversity of the state overall. The WV annual report saves us a lot of time by answering both questions simultaneously. The overwhelmingly majority of the program’s participants are White (88%), while roughly 5% of participants are Black, 3% are Hispanic and just under 2% are Asian. The program appears to be slightly more diverse than the state’s overall population, as the data shows WV is 93% White, 4% Black, 2% Hispanic and 1% Asian.
The report also includes data on the grade level of the participants. Students entering Kindergarten were the largest group with 1,869 students, or just under 20% of the program. In fact, nearly half (45%) of the total participants are in grades K-2.
One area of key demographic data I’d like to see featured in future reporting would be the household income of program participants. Income data would be quite helpful in answering questions as to whether these types of programs are more likely to be used by higher income families in the state.
1. Microschool data! For those interested in the role Microschools play in universal school choice programs, this report shows how many students have enrolled in a private or nonpublic school, as well as those students who are receiving their education through an individualized instructional plan (IIP). Students using an IIP are defined as “students receiving a customized educational experience that takes place either at home or another location, such as a microschool.” Just over two-thirds (69%) of WV Hope students have enrolled in a nonpublic school, while 31% of students are using an IIP. This represents a slight change from last year’s report, which showed 75% of students enrolled in a nonpublic school and only 24% of students utilizing an IIP.
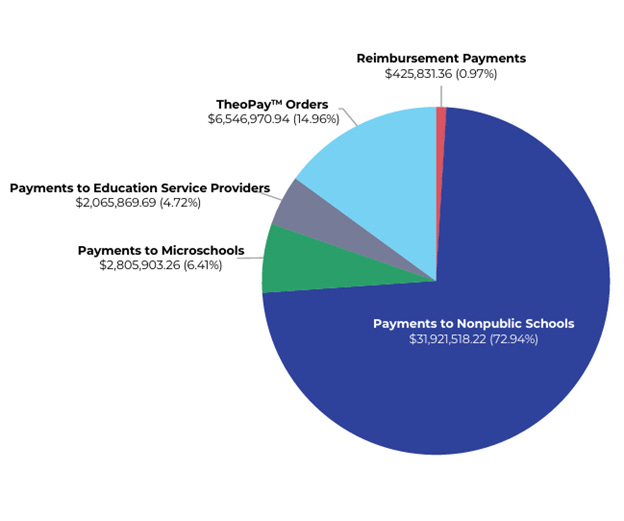
The financial summary section of the report breaks down the spending even further. Roughly 6%, just under $3M, of the total spending in the program went to microschools. Additionally, the report lists out the top 10 microschools in terms of total amount paid. There is a complete list of microschools that received Hope funds in the appendix as well. This is a sharp break from last year’s report, where microschools were hardly mentioned.
2. TheoPay. Mentions of TheoPay are scattered throughout the report, including accounting for $6.5 million, roughly 15% of all Hope scholarship payments. TheoPay is an app, managed by Student First Technology, that allows parents to shop on approved external websites using their ESA funds. TheoPay scans the cart for eligibility under the Hope Scholarship qualifying expense limitations. Once approved, the submitted order goes to the Hope fulfillment team who manually place the order with the vendor and sends the items to the student’s home. I had a conversation with Student First CEO Mark Duran, who confirmed to me it is the first of its kind and is only being used in WV at this time.
The report lists the top 10 TheoPay vendors, with Amazon being far and away the largest in terms of amount spent. It dives deeper into the products being purchased using TheoPay, with books/curriculum and computers being the two most popular.
From a macro perspective, technologies like TheoPay appear to be a massive help in eliminating wait times and other issues that reimbursements cause for families participating in ESA programs.
3. More than just charts and numbers. Importantly, there are a few testimonials from Hope recipients included in the report. One highlights a military family who benefitted from an eligible policy approved in 2024-25 that allows WV military families that had temporarily relocated to another state to remain eligible for the program. These stories are important reminders that the success of a private school choice program cannot be examined solely through quantitative measures like test scores.
In that vein, parental satisfaction ratings on the program would be a valuable resource to include in future reports. Based on WV statute’s reporting requirements for the program, it appears likely that parent satisfaction data will be among the many data points tracked in the next report.
As ESA programs expand nationwide and participation rates rise, strong transparency and reporting are critical to ensuring the programs are delivering on their promise to families. Unfortunately, there is quite an imbalance in reporting and transparency in states with robust choice. States like Arizona, Arkansas and West Virginia have invested time and resources to ensure key details about their programs are readily available for the public eye. On the other hand, Florida (the state with the highest student participation in choice programs) has gone more than 3 years without releasing an annual report on their choice programs.
Unlike traditional public school systems, school choice programs have an opportunity to be far more transparent by publishing centralized, accessible data on participation, providers, and spending. Kudos for West Virginia for delivering on that.
 |
|