


Declining enrollment is a financial windfall for school districts
Why everyone has the story backward, in 4 charts

(This is a guest post by Kennesaw State University economist and EdChoice Friedman Fellow Ben Scafidi)
The media, think tanks, and the academic research community routinely express concern that Covid-era enrollment declines and projections for even more declines in the near future will harm budgets and leave fewer resources for students who remain in district public schools.
My new EdChoice report, “The Enrollment Decline Windfall: Enrollment Declines Leave More Resources for Students Remaining in Public Schools” shows that this “wisdom” that “everybody” seems to share is incorrect. In fact, it is exactly backwards.
Enrollment declines happen. For example, 57.5% of public school districts experienced a decline in student enrollments between 2018 and 2019; about 59% saw a decline between 2015 and 2019; and almost 63% of districts saw an enrollment decline between 1998 and 2019. Thus, we can see how this affected funding levels.
Let’s zoom in on enrollment and funding changes for the 2018 and 2019 school years.
Total Expenditures Per Student, Academic Year (AY) 2018 and AY 2019
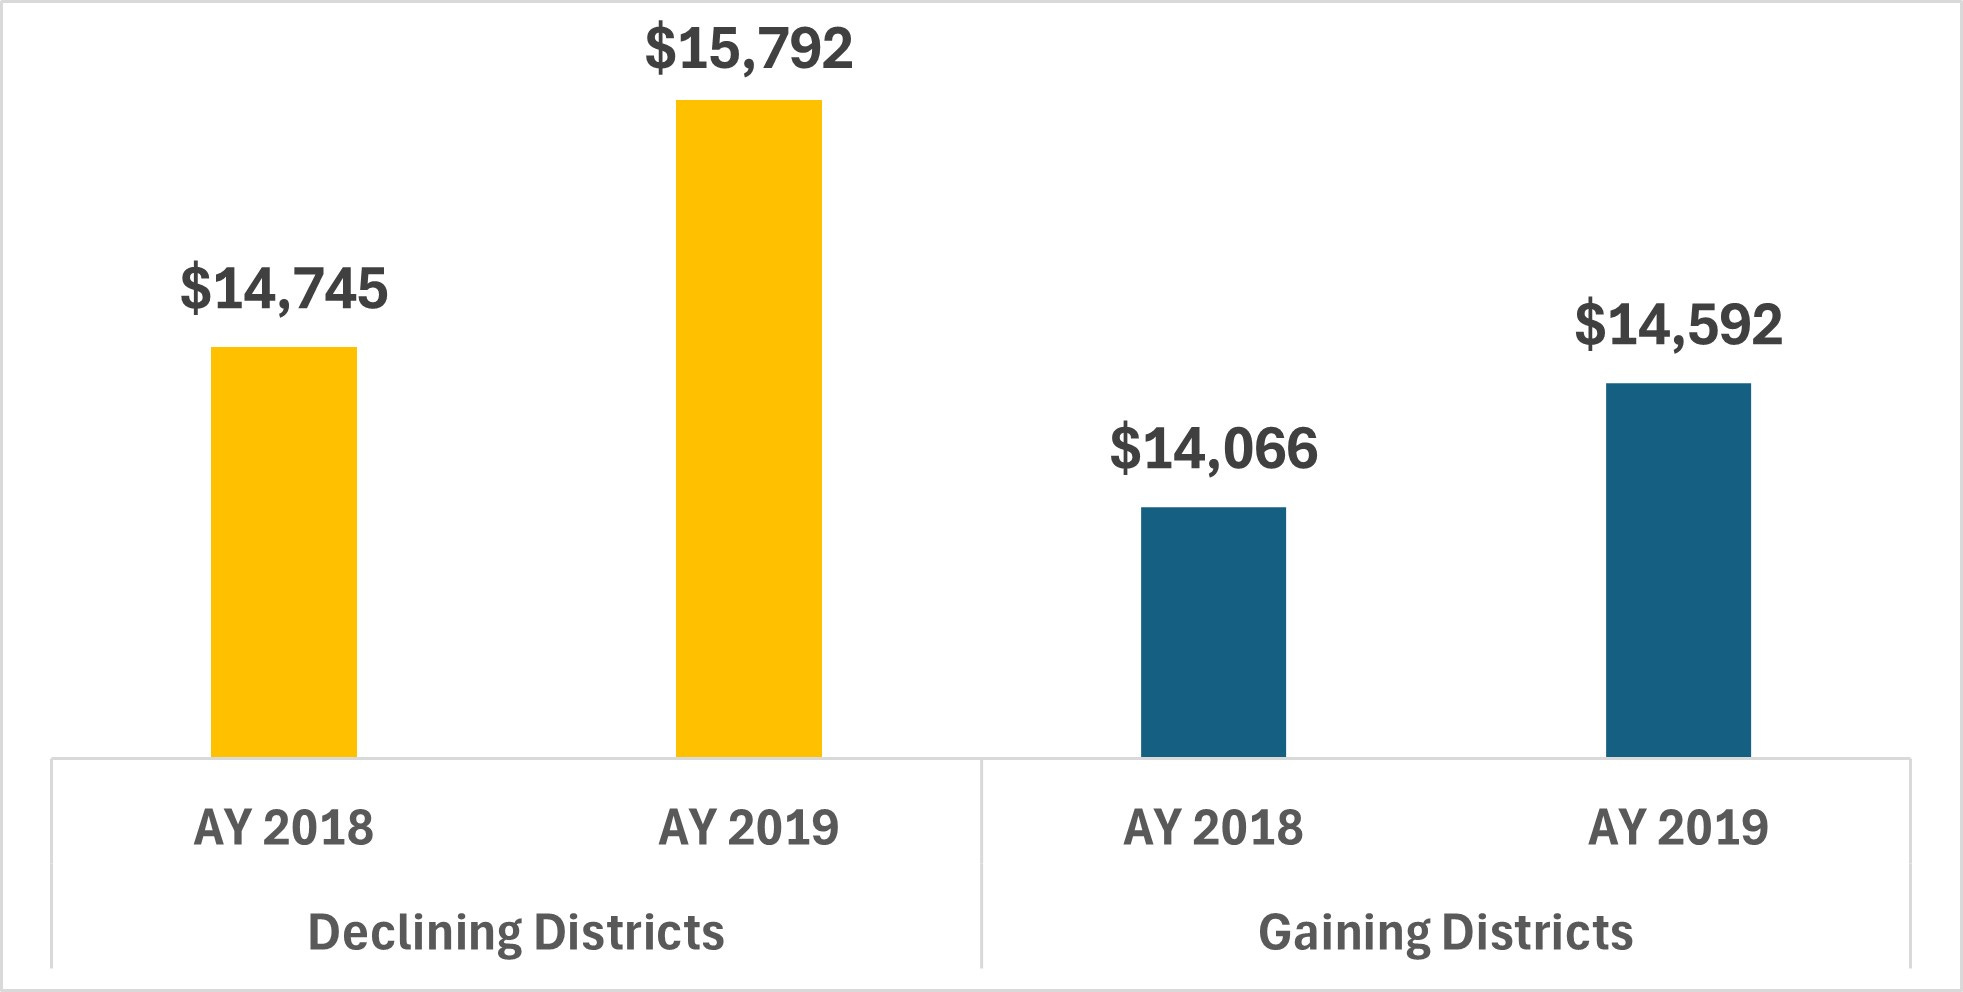
The data used to create this figure and, unless otherwise indicated, other tables and figures in this blog post and the report, come from the Common Core of Data, National Center for Education Statistics at the U.S. Department of Education. The data were retrieved from: https://nces.ed.gov/ccd/elsi/ .
Total expenditures per student increased by 7.1% ($1,047) in districts with an enrollment decline between these two academic years. However, districts that saw an enrollment gain had only a 3.7% ($526) increase in total expenditures per student. [Both of these increases were well above the inflation rate (1.5%) at that time.]
We can zoom out and see if the pattern holds over a longer time period. Here are the numbers from 2015 to 2019.
Percentage Change in District Revenues Per Student by Source, AY 2015 to AY 2019
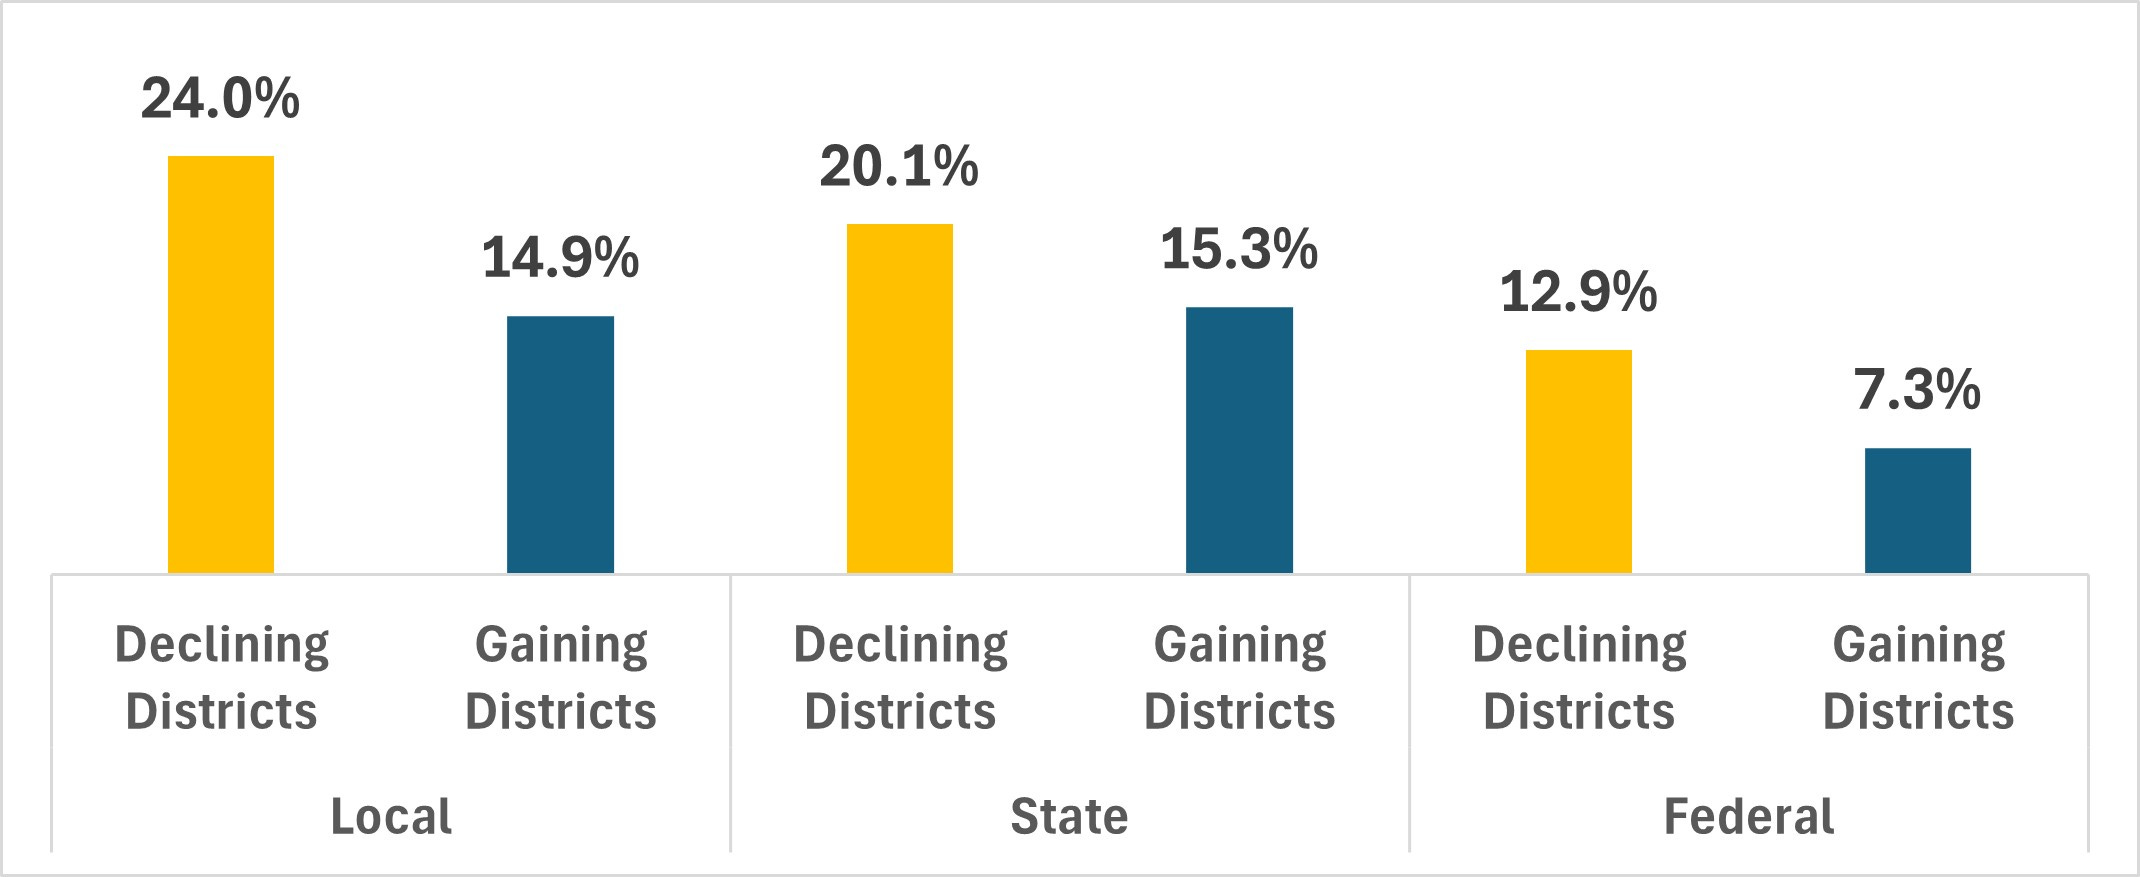
Districts with declining enrollment had significantly larger gains in revenues from local, state, and federal governments than districts with gains in enrollment. These patterns were also present between 1998 to 2019. Each of these increases in revenues per student were above the rise in the cost of living (6.3%) over the 2015 to 2019 time period.
Where is the money going?
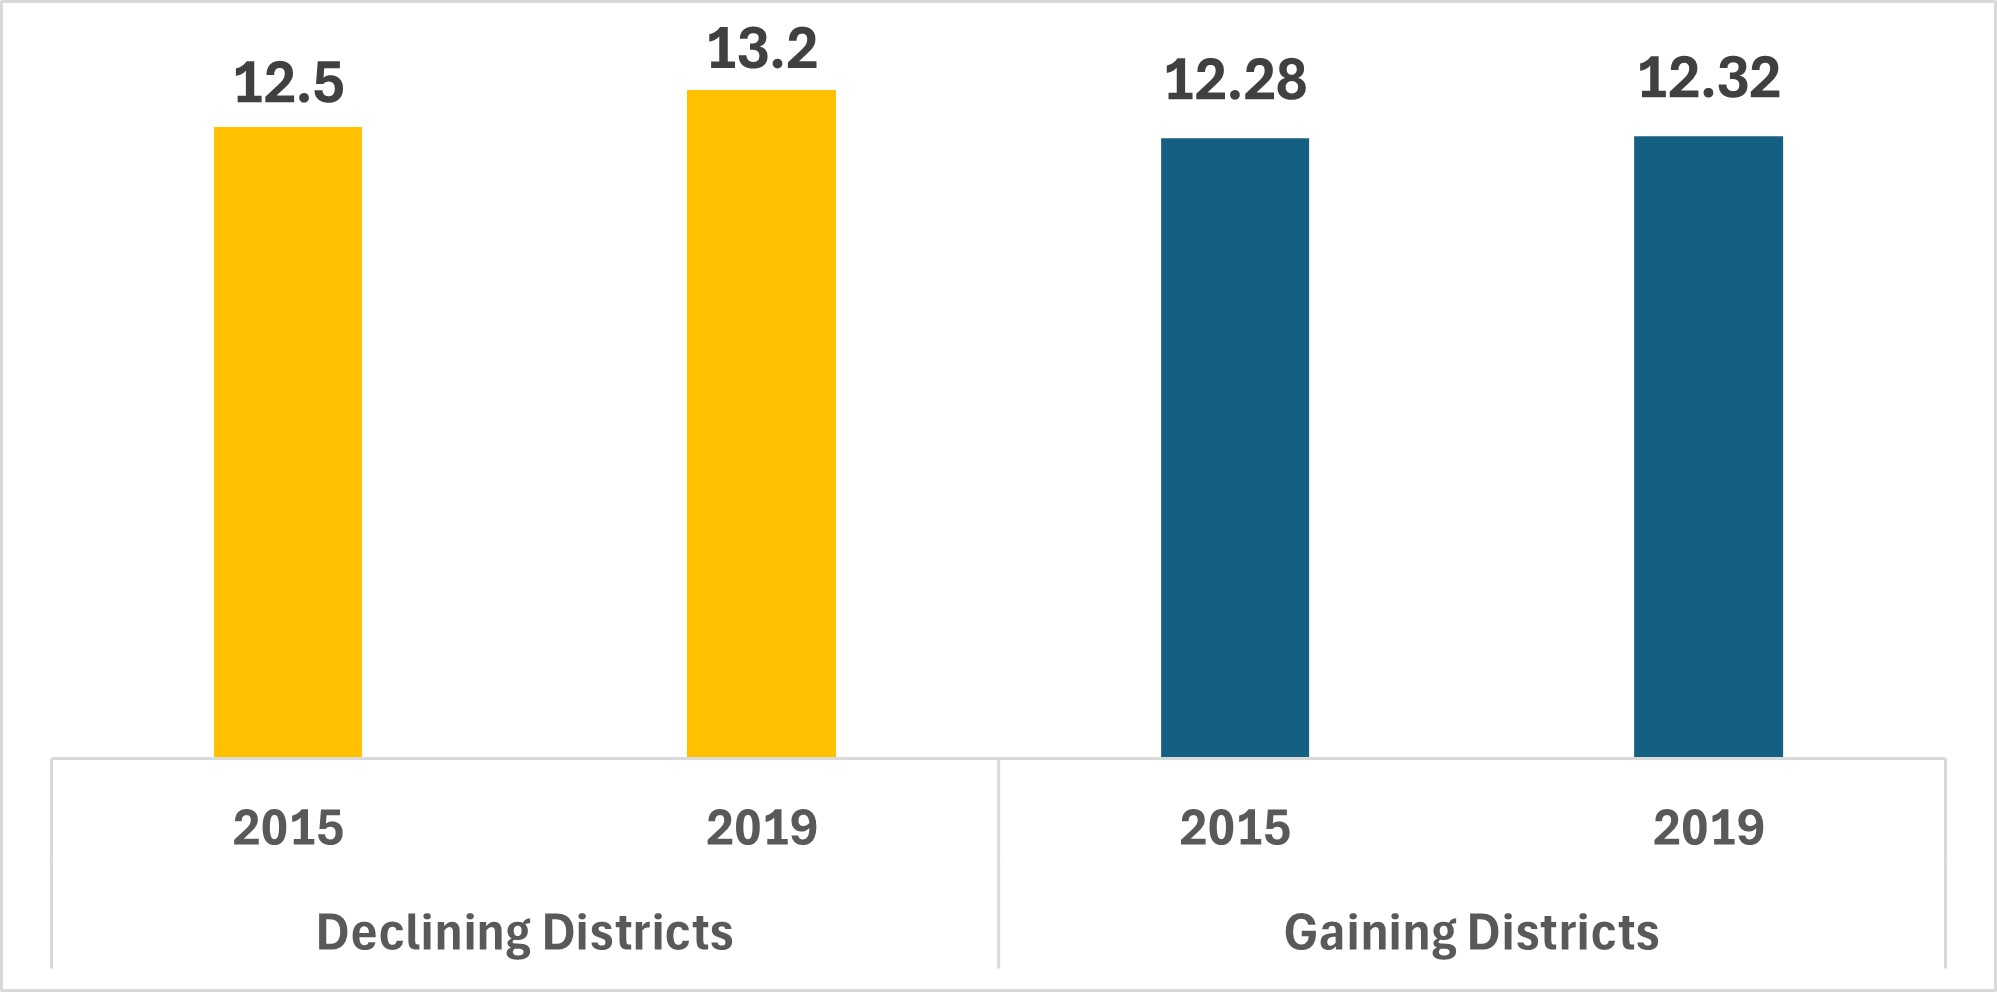
These larger increases in financial resources for students in declining enrollment districts translated into larger increases in real resources as well, such as more staff per 100 students, larger compensation increases for employees, and other increases as well.
Total Staff Per 100 Students, AY 2015 and AY 2019
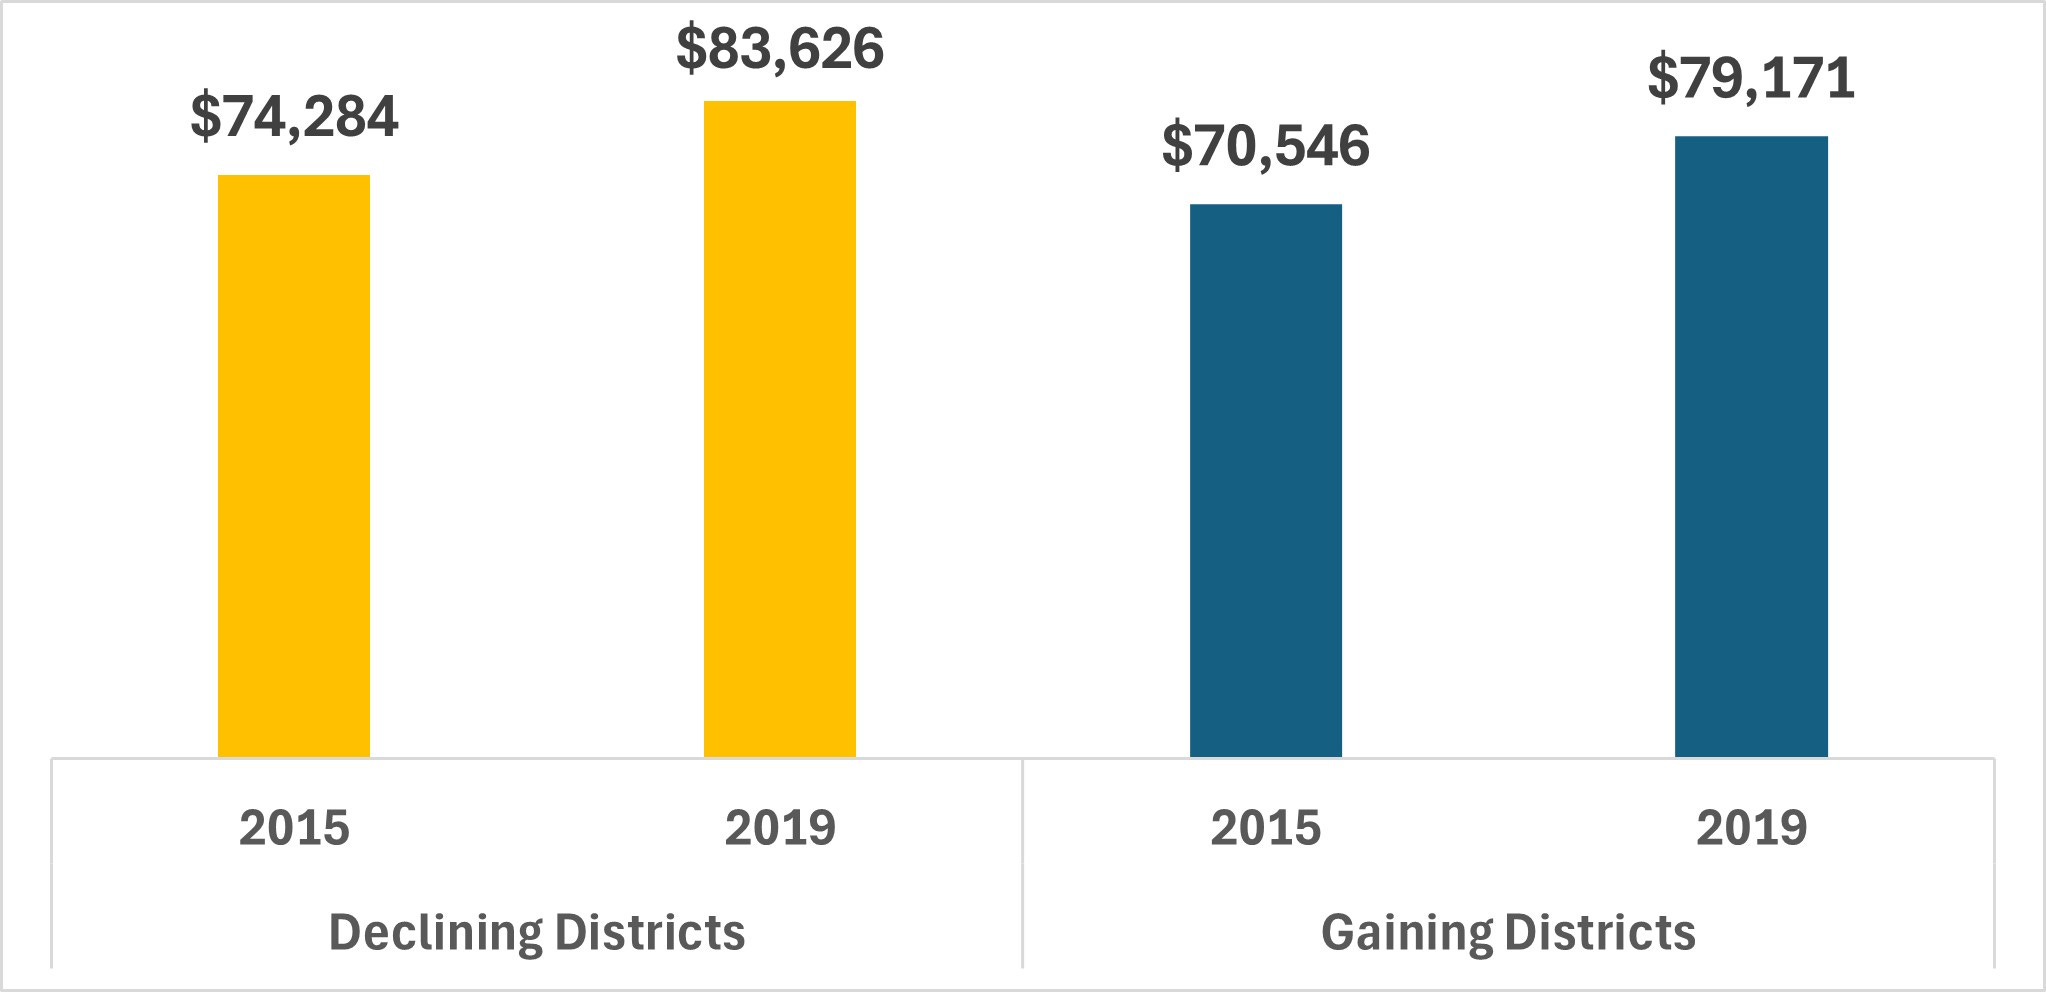
Increases in compensation per employee were about double the increase in the cost of living (inflation), and all public school personnel are included in these averages—teachers, administrators, and all support personnel.
Total Compensation (Salary and Benefits) Per FTE Staff, AY 2015 and AY 2019
These findings should not surprise us. Schools are funded through a mix of local, state, and federal funding. Local property tax revenues in most districts are not automatically reduced when enrollments decline, and capital outlay funds generated via local bond levies are also not automatically cut when student enrollment declines. While a large portion of state funding is tied to enrollment, some of it is not. In practice, federal funding is not proportionately reduced when enrollment decreases.
Contrary to the conventional and widely held belief, public school districts losing enrollment over time do not experience negative fiscal shocks in the short-, medium-, or long-term. On the contrary, school finance systems in America favor districts with declining enrollments. Districts losing enrollment can retain funds for students they no longer serve, which leads to significant increases in real resources for the students who remain.