
How do choice states stack up?
The 2026 Friedman Index


Refer Informed Choice to a friend. If they sign up, you’ll be entered in a drawing for a $100 Amazon gift card. Here is the link:
Around this time last year, my colleague and co-author, Ben Scafidi, wrote a great piece introducing the first edition of the EdChoice Friedman Index. Much of what he wrote regarding the 2025 Friedman Index remains true for the new 2026 Friedman Index. My goal here is to avoid unnecessary redundancies when examining the new report, while also giving those who may be new to the Index the key takeaways.
The Goal of the Friedman Index
What we aim to drill down on with the Friedman Index is simple – how much private educational choice is really available to families in each state?
To answer this, the index examines three key factors: funded eligibility – the percentage of children who are eligible to access funding to participate in taxpayer-funded private K-12 choice programs; flexible use of funds – assessing whether families can apply these funds not only for private school tuition and fees, but also to other educational expenses like tutoring, textbooks, testing fees, special needs therapies, online curriculum, and more; and lastly, funding parity – determining whether choice programs receive funding comparable to state and local per-student allocations for public schools.
The EdChoice Friedman Index ranges from 0 to 100. To achieve a score of 100 on the index, a given state must meet each of the following three criteria:
“All Students”: 100% of the students in the state are eligible to participate in a choice program, with funding available for all who wish to participate (universal funded eligibility).
“All Options”: All choice students are able to participate in choice programs that permit multiple uses, which means families have the opportunity to use the taxpayer funds placed in their child’s account to offset tuition payments at private schools and to purchase educational goods and services outside of schools, (e.g. tutoring, textbooks, test fees, special needs therapies, etc.).
“All Dollars”: Average awards per choice student are equal to the average state and local revenue per public school student, which means that choice students receive the same amount of funding as public school students (sans federal funding), on average.
The EdChoice Friedman Index is calculated using the following formula:
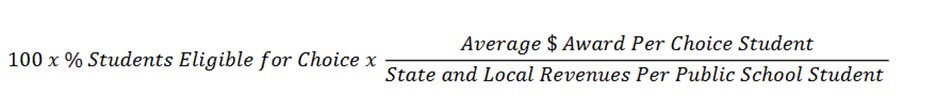
What’s New in 2026
Tiers!
We introduced a tiering system for states in the Friedman Index for the first time this year. There are 5 tiers in all – Platinum, Gold, Silver, Bronze, and Good Start. None of the states achieved status in the Platinum tier (scores of 90-100), while only two states, Arizona and Florida, gained entry to the Gold tier (scores of 70-89). To see where your state resides, you can view the full report here.
We added tiers to the scoring for a few reasons, which are explained in greater detail in the report. The primary reason for adding tiers is to get a better sense of which states are alike in different aspects of their educational choice programs, rather than focusing on small numerical differences between states.
For example, the states with strong funded eligibility (ensuring funding for all students that are eligible to participate in a program) are almost certainly going to be in either the gold, silver, or bronze tier.
States that struggle in terms of funded eligibility, like Utah or North Carolina, are likely to be found in the “Good Start” tier. Practically speaking, it doesn’t make sense to have a state like Utah, where funding is limited to a certain number of students, in the same tier as Ohio or West Virginia, states that offer funding to any eligible student that wishes to participate in a choice program. This is a fundamental difference worth highlighting.
Of course, key distinctions exist even among states in the top tiers. Take, for instance, states like Arizona and Arkansas. Despite both states having ESA programs that fund all eligible students that wish to participate, they are in two different classes when looking at the level of funding choice students receive compared to the funding public school students receive. Arizona’s score propels them into the gold tier because choice students receive a level of funding that is in the same ballpark (83%) as public school students, on average. Arkansas is in the silver tier because choice students receive about 58% of the funding that public school students in the state receive, on average. States’ success towards achieving funding parity between choice students and public school students is the key ingredient to look for in states in the gold, silver, and bronze tier.
Score Tracking
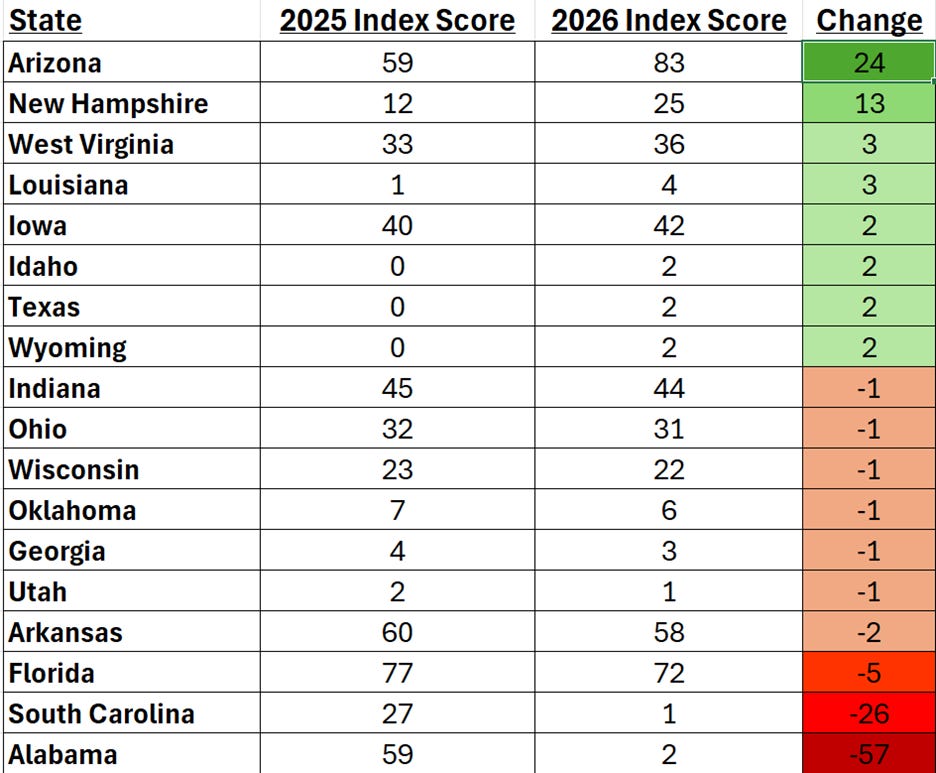
Something that Ben and I were looking forward to after the 2025 Friedman Index release was observing the change in scores from one year to the next. As you can see from the graphic below, there were quite a few changes to examine! Score adjustments differed by state, as well as the cause. There are three major sources of change that we observed between year 1 and year 2.
New Information
Scores changed for two main reasons. The first is that programs themselves changed. Eligibility was expanded, funding was increased.
But the biggest changes in scores occurred because Ben and I learned new information about programs in these states. In Arizona, for instance, we heard from partners on the ground that our average award amount per choice student was an underestimation of the true amount choice students are getting. After diving deeper into the data, we found that we had indeed short-changed Arizona on their “All Dollars” score.
We learned more about programs on the other end of the spectrum, as well. Initially, we had scored Alabama’s and South Carolina’s “All Students” quite strongly in 2025. After the release, we learned about the budget caps that existed in both of the states’ ESA programs, which inevitably lowered the programs’ funded eligibility and the states’ “All Students” score.
This is a key aspect of the Friedman Index. We do not pretend to be the smartest people in the room for each state. We rely heavily on those on the ground in each state who are much more familiar with these programs to point out where we might be wrong about these programs. We make note throughout the report on how to contact us if you have more up to date details about your state’s choice programs. This was incredibly helpful in the first year, and we hope this continues in the future.
Legislative Action
A handful of states did make changes to their programs (or created programs) in their legislative session, impacting their scores.
New Hampshire represents the biggest change, jumping from a score of 12 in 2025 to 25 in 2026. This is due to the fact NH increased eligibility to include all students in the state.
States like ID, TX, and WY all introduced choice programs for the first time in their respective states. Their scores jumped slightly from 0 to 2, highlighting the fact these programs are limited in one way or another. Regardless, these states deserve praise as they are providing families in their state with private educational choice for the first time.
States like IA and WV saw their scores increase modestly because they increased their award amounts for students participating in the ESA programs.
A Lack of Action
There was a third reason scores changed. Some states saw their score change due to a lack of action. These states, most notably AR and FL, did not increase their award amount for choice students enough to offset the increase in state and local revenues for public schools. In Florida’s case, their average award amount stayed flat from 2025 to 2026. States with choice programs need to be proactive in making sure that funding for choice students increases at the same rate as it does for students in public schools, otherwise the parity gap will continue to widen.
As Milton Friedman once said, “Education spending will be most effective if it relies on parental choice and private initiative – the building blocks of success throughout our society.”
A Big Thank You
We’d like to thank our communications team at EdChoice for making this report look as it does today. I promise, if Ben and I had this responsibility no one would have spent more than a few minutes before clicking the big red X!
We’d also like to thank those who helped us learn more information about these programs. The main goal of this report is to gauge the true level of private educational freedom that exists in each state. We feel we are better off in achieving this goal because of your invaluable help.
Finally, a big thank you goes out to all the people working tirelessly in states across the country to ensure that all families have access to a quality education. The job is difficult, yet more necessary than ever. Keep up the good work!
If you have a choice research-related question, you can send it to informedchoice1996@gmail.com and you might see it answered in a future Informed Choice post.
 |
|