
How Would ECCA impact the EdChoice Friedman Index?
I’d like more than just a scratch off map, please.

How much private educational choice will really be available to families in your state if the federal Educational Choice for Children Act (ECCA) becomes law?
This is a question I was asking myself after a planning meeting for The Blue State Overcoming Barriers to Education Freedom Coalition.
The next day I stood at my desk preparing to pinch hit in an EdChoice Friedman Index webinar for my colleague Colyn Ritter while he was busy representing EdChoice at the American Association for Public Opinion Research (AAPOR) 80th Annual Conference and I couldn’t stop thinking about the map for the 2025 EdChoice Friedman Index.
How will the map change if ECCA passes?
Any nerds (written endearingly) who have been following EdChoice well before this Substack existed might know I have a penchant for making maps. And as an inquisitive nerd myself, I pulled the thread and kept pulling.
Here is what I did. I took the numbers from the EdChoice Friedman Index and incorporated the additional number of students with guaranteed funding through an ECCA-like program per state from Colyn and Cooper Conway’s piece from a couple of months back to generate updated EdChoice Friedman Index scores.
A couple of caveats: (1) Colyn and Cooper’s numbers were based on the guaranteed allocations from the $10B ECCA cap whereas the more recent "One Big Beautiful Bill Act" has a $5B cap, (2) Colyn and Ben Scafidi are extremely generous to states by rounding to the nearest positive number because my calculations show a lot of states would otherwise have negative scores.
And thus, the second map below shows the impact of the passage of an ECCA-like program on the EdChoice Friedman Index—states that had a “0” score now have a “1” score:
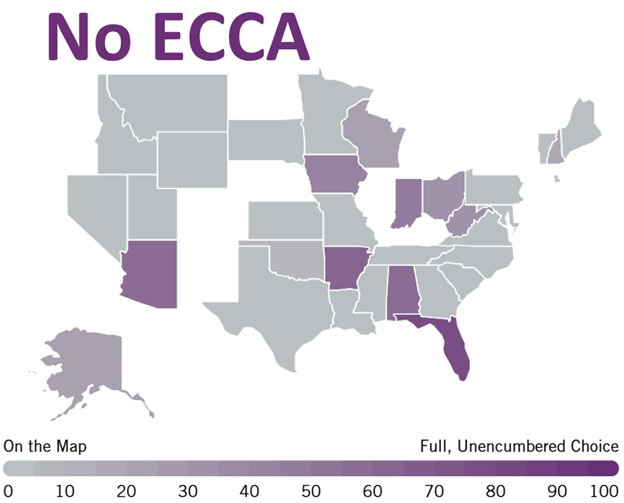
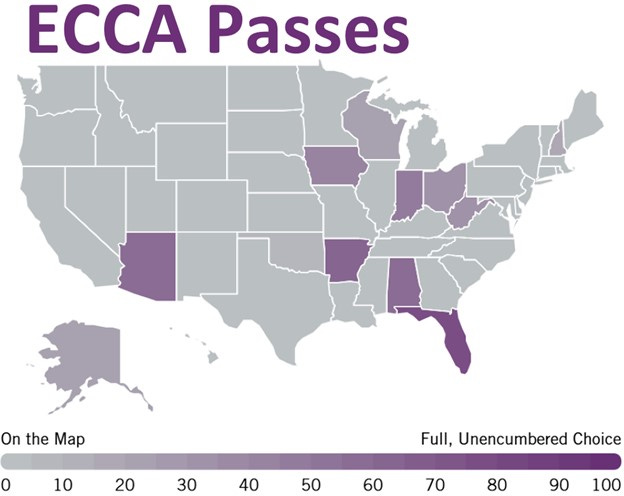
That’s it. That’s all we’re doing here. Just filling in blanks on a map like those versions where you scratch off each state you visit.
Now, if we assume that we hit the cap of $5B in year one and the funds are equally distributed among geographic areas, it appears that D.C. and states with fewer than roughly 250,000 K-12 students would have an additional shift in their index score by a point or two. But here at EdChoice, we want more. Based on our polling, families want more. Let’s help them get it all.
All Students. All Options. All Dollars.℠
 | A guest post by
|