
More Money More Problems?
Per-pupil expenditures in choice and non-choice states


Total K-12 spending in America passed one trillion dollars. In April, the National Center for Education Statistics (NCES) released updated (2023-24) federal financial data on public school spending. The new NCES report has garnered much attention, in part due to that fact. For those interested in a high-level summary of the report, we recommend reading Mike McShane’s recent post.
We use the data to ask a different question: what has happened to public school spending and enrollment in states that adopted private school choice? Let’s wind back the clock to 2004. The same year of Facebook’s launch and the final episode of Friends. Time certainly flies.
Comparing 2004 to the new fiscal year (FY) 2024 data give us a 20-year window into how public school spending has changed nationally and across states. With the state level data we can ask questions like: How do choice states compare to non-choice states? How do both sets of states compare to the national average?1
A common criticism of private school choice is what we’ll call the “drain claim”: the argument that educational choice programs pull money and students out of public schools, leaving district schools with fewer resources.
This argument shows up often in advocacy and media coverage. Save Our Schools Arizona, for example, warned that Arizona’s universal ESA costs would “starve public schools” and “bankrupt the state,” while also claiming every public school would lose desperately needed dollars. The Century Foundation argues that voucher incentives can undermine public schools’ financial stability and that “even modest enrollment shifts can lead to school closures, consolidations, and reduced services.” The National Education Association says vouchers “take scarce funding from students in public schools,” and elsewhere argues that vouchers “siphon crucial funding from public schools.” The Economic Policy Institute similarly argues that voucher programs “redirect money away from traditional public schools,” while the Center on Budget and Policy Priorities has warned that voucher expansions will “deplete available state revenues for public education and other critical services.”
We use the last two decades of NCES data, from 2004 to 2024, to examine whether the basic spending and enrollment trends in choice states resemble that story.
A Basic Check on the “Drain” Claim
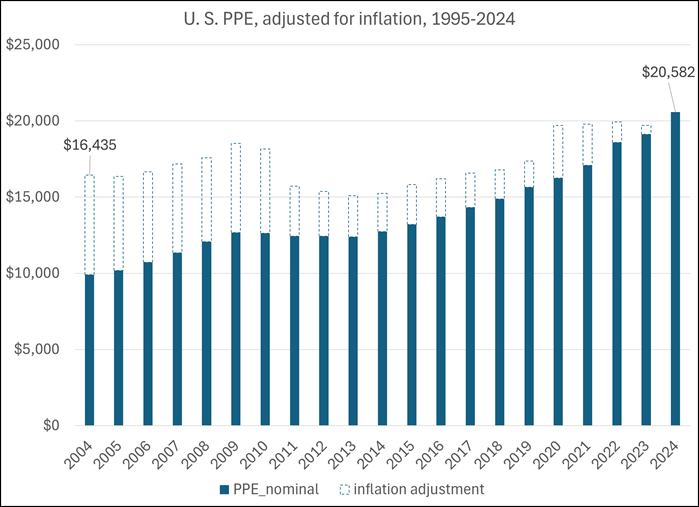
Perhaps the place to start is by looking at the change in total per-pupil expenditure (PPE) at a national scale from 2004 to 2024. Adjusted for inflation, the United States spent an average of $16,435 per public school student in FY 2004. By FY 2024, that figure jumped to $20,582, a 25 percent increase.
Choice States, Non-Choice States: At a Glance
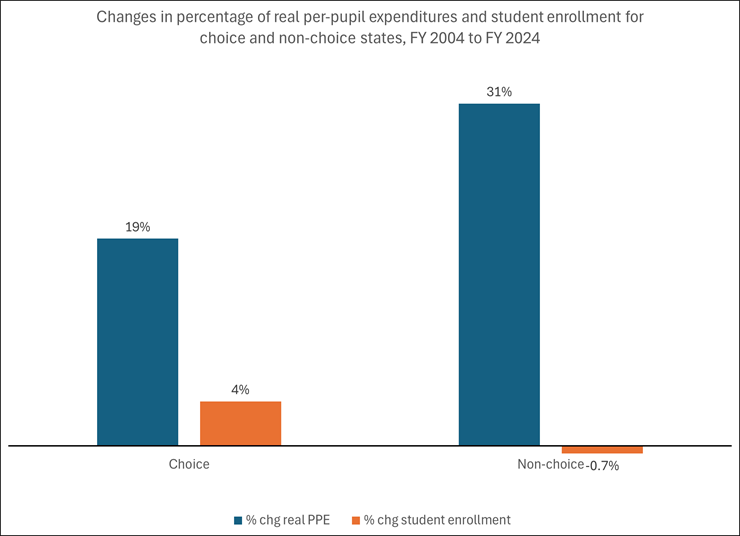
Non-choice states saw a larger increase: real per-pupil spending rose 31 percent, from $17,680 in FY 2004 to $23,130 in FY 2024. Hawaii is the biggest outlier of the group, with a 69% increase in per-pupil public school spending in the 20-year sample. At the same time, Michigan is quite far off in the other direction, with only a 9% increase from 2004-2024.
What about choice states?
Choice states also increased spending per pupil, though by less than non-choice states and the national average. From FY 2004 to FY 2024, real PPE in choice states rose 19 percent. Arizona, Florida, and Ohio—three large choice states—saw increases of 25 percent, 16 percent, and 12 percent, respectively. Indiana was the notable exception, with real PPE declining 6 percent over the period.
To state it plainly, public school spending did not collapse in states with private school choice. In many of the largest choice states, real public school spending per pupil rose substantially even as those states expanded educational options outside the public school system.
This raises another question. How has public school enrollment shifted as states (besides Indiana) continue to increase spending in their public schools?
Broadly, the US had a 2% increase in public school enrollment (about 700,000 students) from 2004-2024.
Non-choice states, however, experienced a 1% decrease in public school enrollment in the same 20-year span. Texas (which ultimately will become a choice state after 2024) is an outlier with 28% growth in public school enrollment. Michigan is on the other end of the spectrum, with a 19% decline in public school enrollment from 2004 to 2024.
Public school enrollment among choice states increased 4% on average over the same period. Utah (39% increase in public school enrollment) and New Hampshire (24% decrease) are the bookends among this group.
Accounting for When Choice Programs Actually Began
Of course, that simple choice-versus-non-choice comparison is only a first cut. States adopted choice programs in different years, so a cleaner exercise is to line states up by the year their first private school choice program began. When we account for timing, the basic pattern remains: public school spending and enrollment do not show a post-choice collapse.
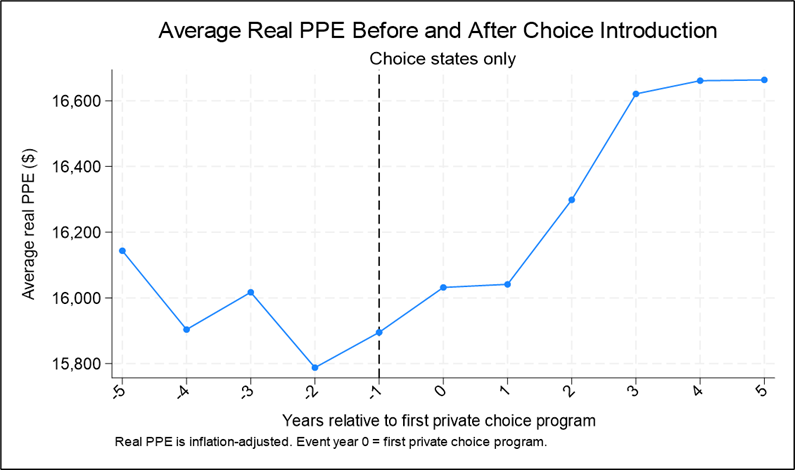
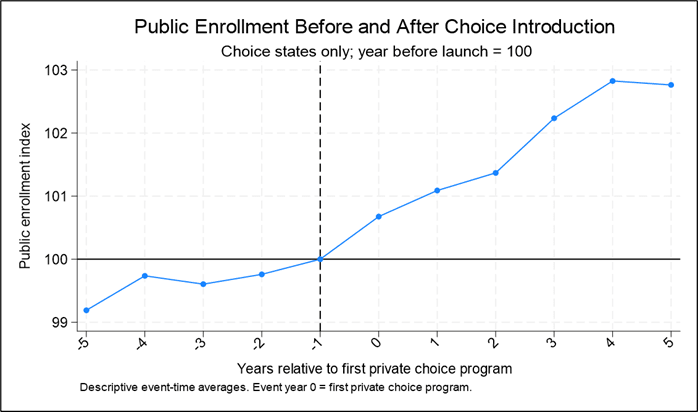
To do this, we line up choice states by the year each state introduced its first private school choice program. The launch year is event year 0. The year before launch is event year -1. For spending, we report the average real, inflation-adjusted PPE among choice states in each event year. For enrollment, we use an index because raw enrollment counts are heavily influenced by state size. Event year -1 is set equal to 100, so values above 100 mean enrollment was higher than the year before choice began.
The number of choice states contributing to the event-year averages ranges from 26 to 31 states because not every choice state has data for the full five years before and after launch. The underlying data cover FY 1995 to FY 2024.
What Happens After Choice Begins?
In the five years before choice, average real PPE among choice states hovered between about $15,800 and $16,100 per student. In the year before launch, average real PPE was $15,895. It rose to $16,032 in the launch year and $16,664 five years later—an increase of about $769 per pupil, or 4.8 percent. That does not prove that choice caused spending to rise. But it is hard to square with the claim that choice programs lead to a collapse in public school spending.
Enrollment tells a similar story. Public school enrollment in choice states was slightly below the year-before-launch baseline during the pre-period, then increased modestly after launch. Five years after launch, the enrollment index reached 102.8, meaning public school enrollment was about 2.8 percent higher than the year before choice began. Again, this is descriptive rather than causal, but it complicates the claim that choice programs necessarily drain students and dollars from public schools.
Taken together, the spending and enrollment patterns point in the same direction: after choice began, the average choice state had higher real PPE and higher public school enrollment than it had just before launch.
What Does This Say About the “Drain” Claim?
When opponents claim that choice drains public schools, they often skip the basic spending and enrollment data.
There are also reasons districts may not experience the immediate fiscal blow that critics often predict. Many states have funding protections, such as hold-harmless provisions and declining-enrollment adjustments, that help districts adjust as enrollment changes. Work by Ben Scafidi and Matthew Lee from Kennesaw State University also suggests that declining-enrollment districts often see larger per-pupil funding increases than enrollment-growth districts, which complicates the simple story that fewer students automatically means fewer resources per student.
None of this means choice has no fiscal effects. But the basic data do not support the most overheated version of the “drain” claim. The facts show that in states that adopted private school choice, real public school spending per pupil rose after launch, and public school enrollment was modestly higher five years later.
The better debate is not whether choice automatically devastates public schools, but how states can fund students fairly, give districts time to adjust to enrollment changes, and expand educational opportunity. Choice is now part of the public education finance landscape; policymakers should design that landscape with families in mind.
For context, we categorized choice states as those with any choice programs (ESAs, vouchers, tax-credit scholarships, tax-credit ESAs, and refundable tax-credits) that launched before FY2023. That would exclude states like Texas or Wyoming, to be clear.
 | A guest post by
|
 |
|