


What is an education provider, anyway?
New research identifies the educational providers in ESA states


Education savings accounts (ESAs) have overtaken vouchers as the darling mode of private school choice for one major reason: flexibility. While vouchers are designed exclusively to cover private school tuition, ESAs cover a variety of educational expenditures. For example, most ESA programs allow families to use funds to pay for tutoring services, educational therapies, and curricula.
When ESAs are created, we would expect demand for these non-tuition education services to rise, and in turn we presumably would see supply of these resources rise to meet that demand. A new report by Susan Pendergrass, EdChoice Fellow and Director of Research at the Show-Me Institute, found early evidence that states subsidizing private school tuition do see increases in the total number of private schools relative to states that do not.
We also should see growth in non-school education resources. It's not particularly easy to see the extent to which this is happening. Just three states both offer public lists of service providers for current or upcoming school years and identify what kind of services they provide. A fourth, Arizona, provided data to Pendergrass, which were included in her report. Below is Susan’s analysis of Arizona’s providers and our best counts for the most recent data from Indiana, North Carolina, and Tennessee.
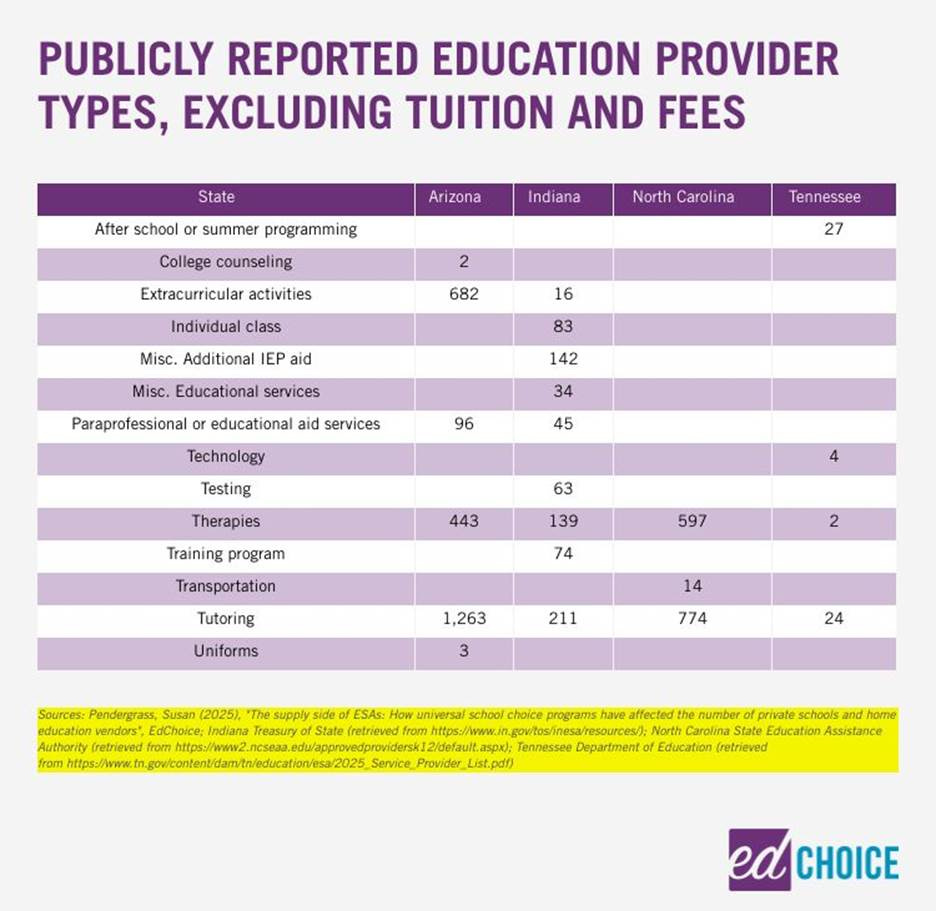
What do these data tell us? For one, they confirm that there are indeed students with disabilities using ESAs to access supplemental services. Indiana and North Carolina restrict ESA access to students with disabilities, leaving a standard voucher program for the rest of the student population, and Arizona’s ESA was targeted to students with disabilities prior to 2022. We would expect there to be demand for educational and occupational therapies with ESA dollars. While North Carolina only sorts its providers into three categories, it’s worth noting that 43% of them offer therapy services. Just short of a fifth of the providers in Arizona do as well.
Indiana’s detail provides another insight about students with disabilities and ESAs, as there are several categories relating to service provision in fulfillment of a student’s education plan. We’ve combined these into the “Misc. Additional IEP Aid” category. With more providers falling into this category than providers offering therapy services, it’s a reminder that special education often is more than just instruction and therapy. Flexibility and a broad range of allowable expenses can make addressing individual needs easier.
Tutoring is a very popular option. While this conclusion will surprise few people, it might be worth noting just how many tutoring options parents have in these states. There are many reasons a family might seek out tutoring for a child. The most obvious case might be helping a child underperforming in one or more areas catch up to grade level standards. These are the students traditional public schooling tend to prioritize when organizing tutoring efforts. ESAs would make it easier for these students to receive help outside the schooling environment if needed. But a student might be an adequate or even excellent performer in certain areas while aspiring to something even higher. An average math score can pull down an otherwise excellent ACT test, for example. ESAs can make tutoring more affordable for these students.
A few comments about the categories before continuing.
First, Indiana sometimes sorts service providers into multiple categories. Furthermore, several of Indiana’s categories seem to overlap, and for simplicity’s sake, we combined service categories when the distinction between service types was indistinguishable; if we had any doubts, we left them separate.
Second, not all states may categorize a service the same way. For instance, Tennessee presents a “technology” category. Technology intended to aid the learning of students with disabilities might have gotten categorized as a service fulfilling an education plan or a therapy in Indiana. And while we are excluding “tuition and fees” from this table to focus on providers allowing for a more customized educational experience, it’s very possible that some “tuition and fees” in three of the states may well have been categorized as “individual classes” in Indiana. Direct comparisons between states should be taken with caution. All that said, here’s a quick look at ESA providers in each state.
Based on Pendergrass’s research, there are early signs of growth. The total number of non-school vendors in Arizona’s ESA program grew from just under 3,000 in 2022-23 to nearly 5,600 in 2023-24, although not all of these received any customers during this period. Extracurricular activities saw the biggest percentage growth in vendors used, and they rose from making up 24% of all non-school ESA vendors (15% of non-school expenses) to 26% of them (21% of non-school expenses). The number of tutoring vendors rose by more than one-third and served thousands more students year-over-year. While therapy vendors in the program rose only slightly relative to these other categories, they served nearly 28% more students. To see whether the same growth occurs in other expansive ESA programs, we simply will have to wait for more data and work with state departments of education to analyze the data.
That brings me to a final point, which is that more public data would be useful for multiple stakeholders. It would be easier for families considering a school choice program if they were able to see the kinds of options they could access if they participated. It also helps potential entrepreneurs identify where there might be gaps in service provision that they might be able to fill. Finally, it helps analysts like us identify how nimble the education market is; if it is not, it can help narrow down what state or program characteristics can make a program more static.
As a parting note, if you’re interested in this topic, please check out Susan Pendergrass’s report that was mentioned earlier. It’s a bit more focused on the growth or shrinkage of the private education sector over time, and the descriptive data provide more insights than one Substack post can cover.
The demand side of the school choice equation has received almost all of the attention over the last few decades. With more and more states tackling the biggest barriers to helping families access the private education market, it’s important to identify whether education service providers are meeting the needs of these new students.
 | A guest post by
|
 | A guest post by
|
Good blog. Supply side / typical use case has been hard to nail down.