
When Choice Students Take the State Test
Early lessons from Iowa

Refer Informed Choice to a friend. If they sign up, you’ll be entered in a drawing for a $100 Amazon gift card. Here is the link:
We’ve also created an email account if you have a choice research question. Feel free to send it to informedchoice1996@gmail.com and you might see it answered in a future Informed Choice post.
For better or for worse, when Americans ask whether school choice is a good idea, one of the first places they look for evidence is standardized test scores.
Tests are a short-term measure of academic success that we hope can approximate long-term effects like how likely a student is to succeed at higher levels of education or in adulthood. We rely on tests to evaluate education reforms because they are easier to collect and analyze than those long-term effects.
Whether standardized tests actually are proxies for what we really care about is not so clear. Most teachers don’t believe they accurately measure student ability, and they are substantially likelier than parents or the general public to believe schools spend too much time on standardized testing. There’s evidence that test scores don’t accurately predict long-term effects in choice programs, a concept most recently backed up by research on an Ohio voucher program from the Urban Institute that saw negative short-term test score effects but positive long-term attainment effects.
And, to make things more interesting, most contemporary educational choice programs do not require students to take the same tests as their public school peers, making comparisons challenging.
There is, however, Iowa. The Hawkeye State’s education savings account program requires students to take the same standardized test as their peers in the traditional system.
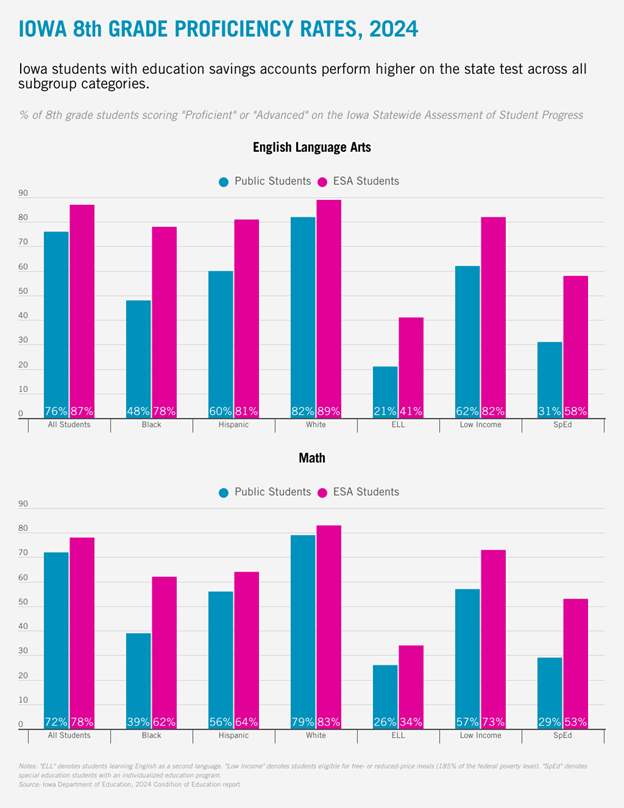
Iowa published these results in its annual Condition of Education report, and they are quite interesting. Here are two charts comparing ESA students and traditional public school students in 3rd grade and 8th grade English Language Arts and Math.[1]
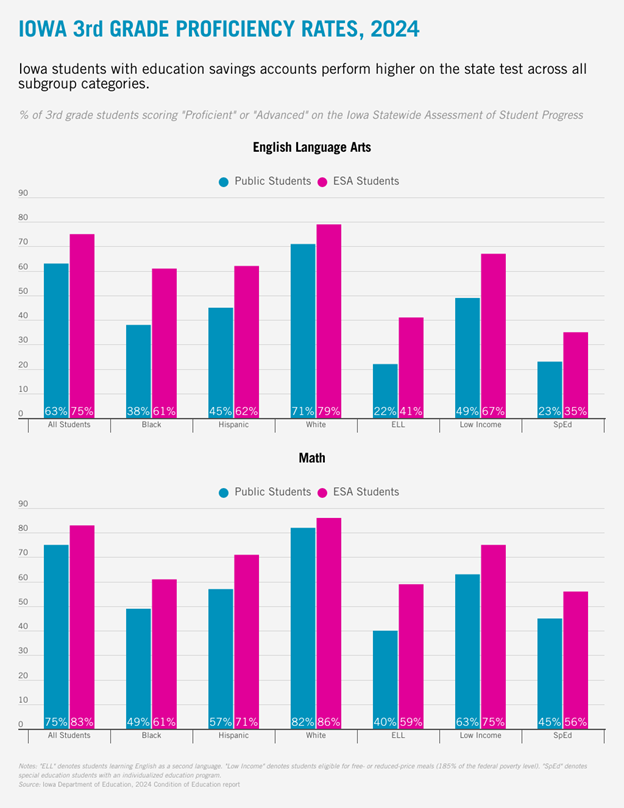
To be abundantly clear, this is a cross-sectional, high-level look at the data, not a rigorous analysis of how responsible the ESA program is for the higher scores among ESA students. There are a lot of biases at play a full study must account for.
As an early look at the data, though, there are some striking results.
In every reported demographic category (I’ve chosen my seven favorites for space), ESA students perform better than students in public schools.
Among race and ethnicity categories, the ESA-public gap is larger for Black and Hispanic students than it is for White students.
Incredibly to me, ESA students learning English as a second language perform about twice as well as public school ELL students.
Students who are income-eligible for the National School Lunch Program (less than $55,000 of annual income for a family of four in 2023-24) perform better than the same category of low-income children in public schools.
Special education students also perform better in ESAs. SpEd students are those who have been given an individualized education plan (IEP), but private schools receiving funds from SpEd ESA kids are not legally required to follow a child’s IEP. Despite this major distinction, ESA kids with diagnosed disabilities are doing better on tests than their public school peers.
It’s worth noting that every ESA student in 2023-24 fit in at least one of three categories:
They attended public school in the prior academic year
Their annual household income was less than 300% of the federal poverty level ($90,000 for a family of four)
They were an incoming kindergartener
It’s very possible that ESA students generally were academic overperformers before joining the program, so we can’t say there’s evidence ESAs cause higher test scores. But if they caused worse test scores, I wouldn’t expect to see gaps like this.
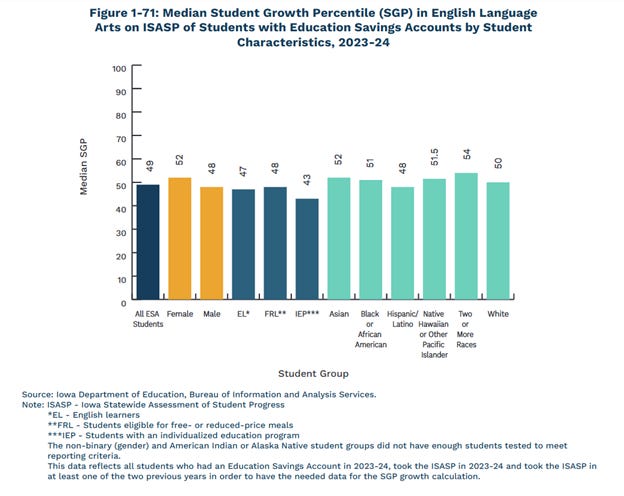
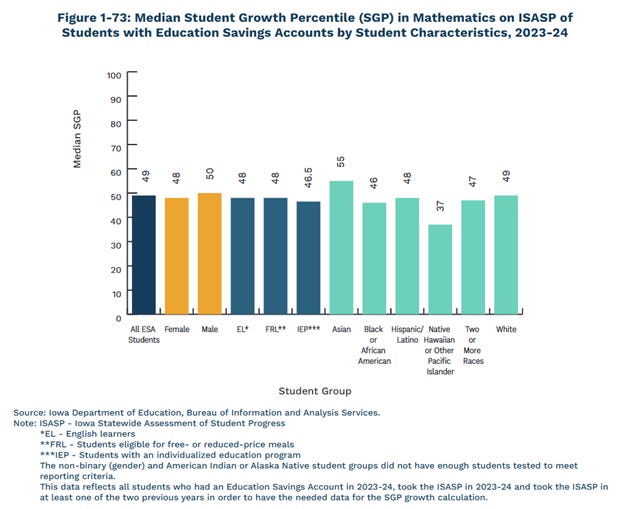
In fact, there is some evidence that higher performers did select into the program. The Condition of Education report offers a growth metric among ESA students, shown for English Language Arts and Math below. This metric evaluates a student’s improvement on the ISASP from 2022-23 to 2023-24. The median result for public school students “in any given year, grade and content area” is represented at 50, so ESA students as a collective are right in line with their public school counterparts.
Unfortunately, this growth metric is not broken down by any grade or demographic categories for public school students, so I cannot know for sure whether a particular group showed more or less year-over-year growth than their peers in public schools. For instance, it seems exceptional to me that the EL ESA students growing in English at the same rate as the median public school student, but I cannot determine what the number for public school EL would be for a proper comparison.
At the very least, you’d be hard-pressed to look at all these data and contend ESAs lead to academic neglect. Results like these also give me some ease about certain selection biases. It doesn’t look like any positive results are going to be driven by student groups who already perform better than average.
In the long-term, I anticipate the research community will do some kind of matching study to estimate the effect taking an ESA has on test score outcomes. (These studies are not without their own limitations, but they are closer to identifying causality than simple between-group comparisons.)
To place Iowa in a national context, the state requires all private schools receiving ESA funds to be accredited, and to be accredited, a school must administer the state test. As such, ESA schools were used to working with the ISASP before the program began. No growing pains required there.
This policy feature distinguishes Iowa from a state like Ohio, which does not have the same history of requiring the state test in private schools. That could be why the Urban Institute study in Ohio found negative test score patterns for choice students despite positive effects for educational attainment—in fact, the researchers specifically point to “curricular differences between sectors and different incentives to perform on state exams” as a compelling reason for the contradictory results.
To be fair, when it comes to private school choice programs, the testing record is pretty good for an education reform. I won’t give space to this claim now, as we have discussed this issue repeatedly in Informed Choice, such as here and here.
Despite its track record, school choice still requires a lot of study, particularly because choice programs have changed so much over time. They’re larger and capture a wider range of the student populace than they did when the bulk of the most rigorous research was done. There are a couple challenges stalling more research, though. It’s a lot harder to have an experimental study when every student is eligible for a program. Selection bias is unavoidable.
Iowa is just one of many programs that will be under a national microscope in the coming years. Regardless of how you feel about its testing requirement, it does present more opportunity for compelling evidence about the impact of school choice. This won’t be the last analysis you see on participant test score effects in Iowa, and this one will quickly be outdated. That said, the first look is a relatively rosy one.
I’ll make sure to update when the second-year results come in.
[1] Truthfully, I anticipated sharing results for school year 2024-25 in this post, as the Iowa Department of Education was scheduled to release those numbers in January 2026. I wanted to see if there were any two-year trends that could teach us something. Alas, at the time of submission, we are still awaiting those 2024-25 numbers.
 | A guest post by
|
Very balanced. Nice work.
Gov. Reynold's leadership on school choice is 💯, it's no surprise students are thriving!